You are looking at an archived version of our site. Please visit thepcc.org for a fresh, new experience!
You are here: Array » How primary care' ...
How primary care's use of telehealth evolved at the start of the COVID-19 pandemic
The onset of the COVID-19 pandemic in March 2020 was a major disruption to many industries and businesses, including primary care. Primary care practices saw most patients in person before the pandemic, but the sudden shutdowns as a global pandemic was declared forced many practices to find a different way of operating. For some, the pivot to providing virtual visits was quick, while others took longer to adapt. This report shows the evolution of primary care's adaptation to telehealth services in the first months of the pandemic. Data to construct the following graphs was from primary care clinician surveys conducted by the Larry A. Green Center and the PCC, specifically the surveys conducted from March 2020 to May 2021.
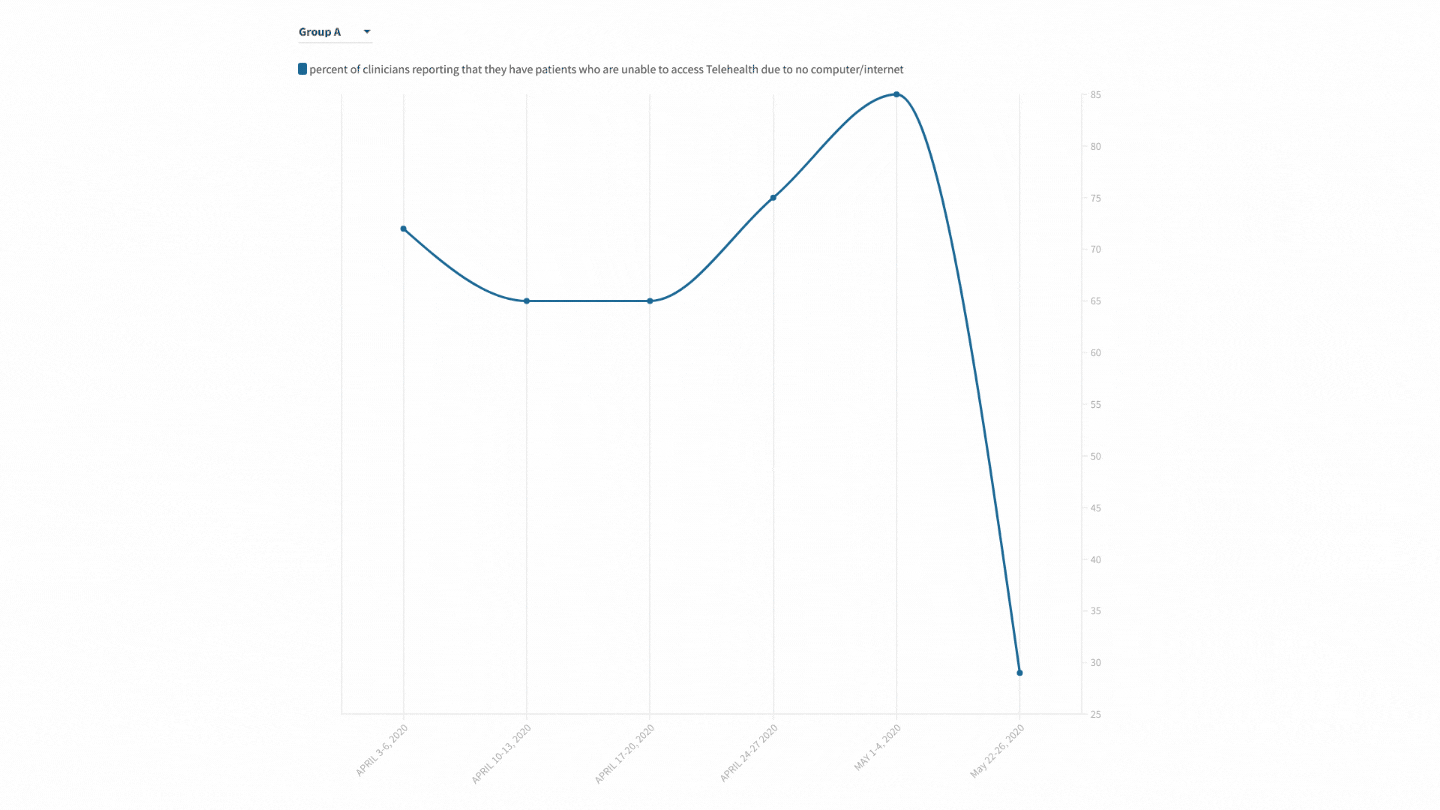
The graph below shows the percentage of clinicians who reported that their patients were unable to access telehealth services due to lack of equipment and/or broadband issues. During just the month of April, there was a gradual decline that starts, from 72% to 65%, meaning more patients were gaining access to telehealth. However, from the end of April to the middle of May, there is a steep increase, from 65% to 85%, meaning patients were unable to access telehealth services. This is most likely due to the sudden rise in COVID cases and lack of resources to respond. Nonetheless, toward the end of May, there is a drastic decline, where only 29% of patients were having no or limited access to telehealth. The data shown is from the first months of the pandemic - from the beginning of April to the end of May - where we go from 72% of patients reporting lack of access to telehealth to only 29%.
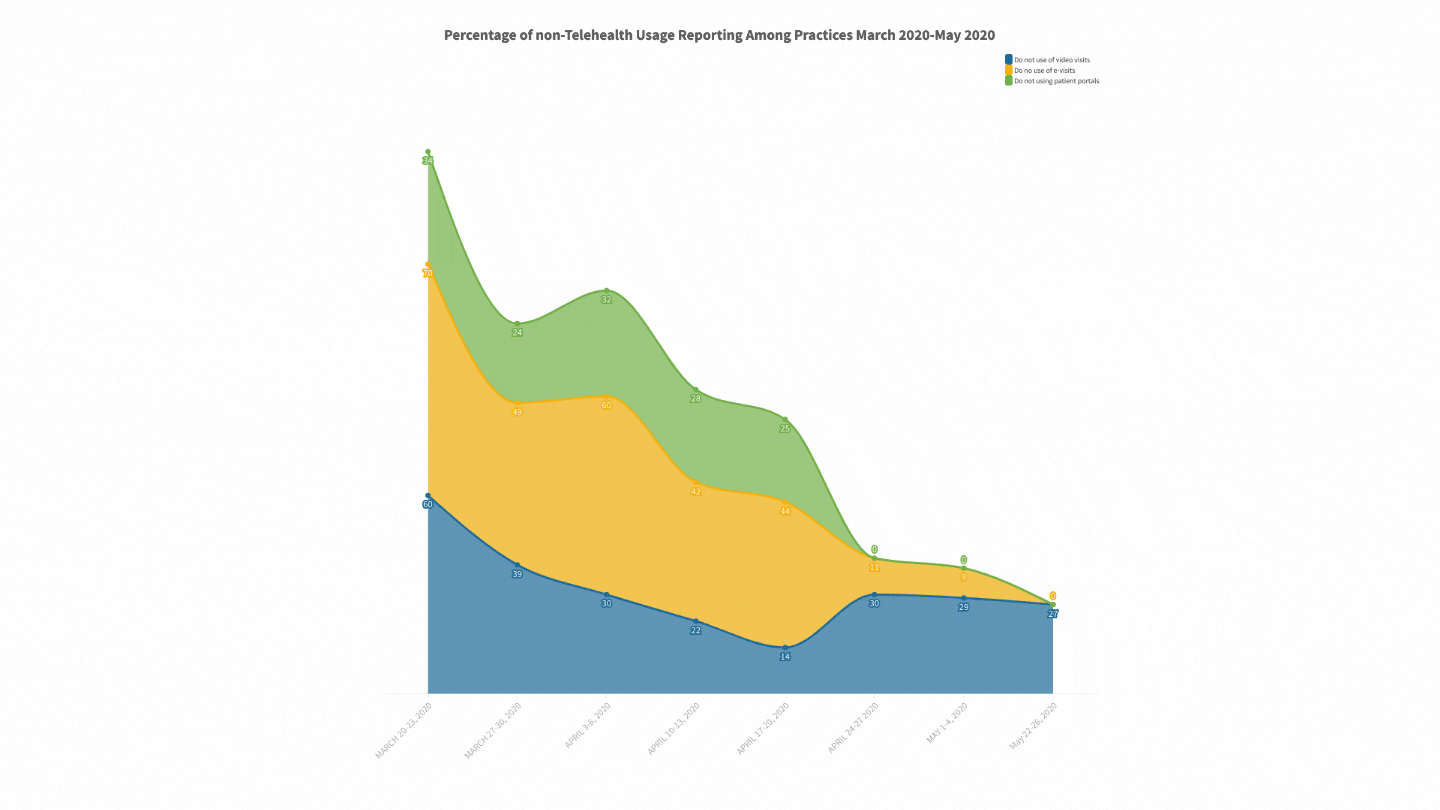
The graph below shows the percentage of non-telehealth usage reported among practices. There was an increase in telehealth video usage from March to May; however, there was fluctuating use of virtual visits and patient portals. Among both, there was an increase in usage in March; however, at the beginning of April, there was a decline in telehealth use and then a gradual rise in usage until May.
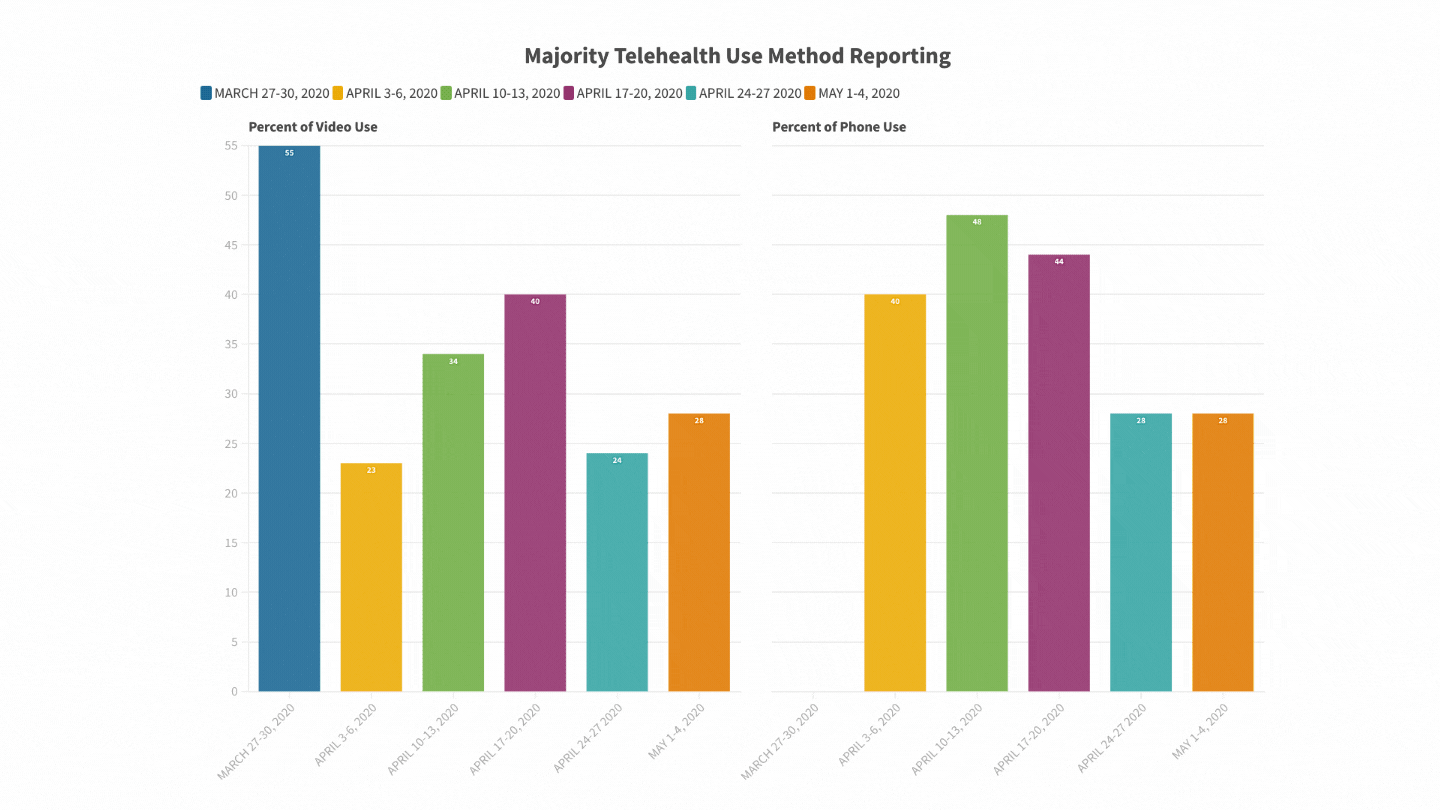
The graph below shows the percentage of majority telehealth used between video and phone. There is an increased use in phone service for telehealth, which shows the increasing adoption and expansion of telehealth.
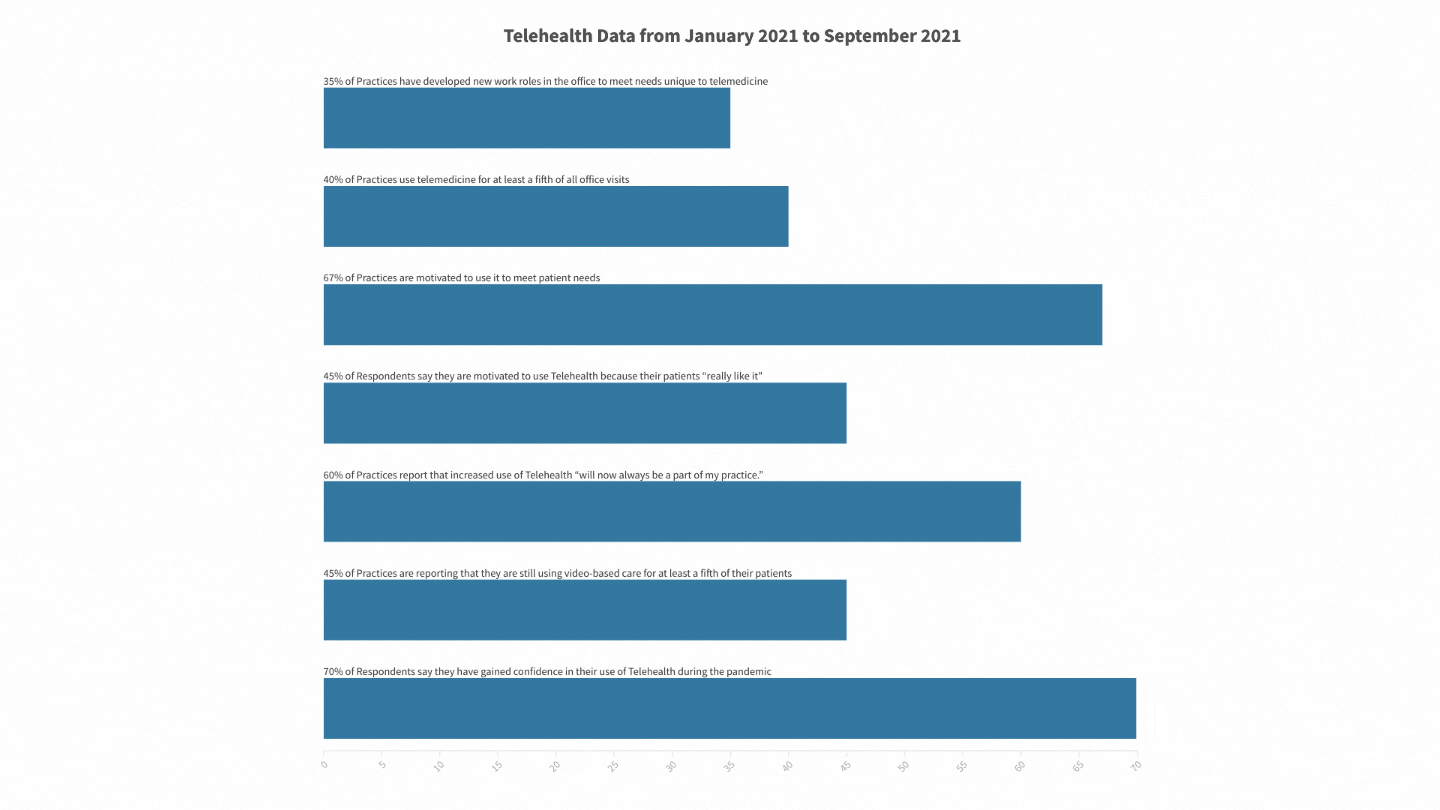
In conclusion, the data shows that primary care was able to quickly move to viritual visits but had scarce resources to maintain it at the time. Nonetheless, in the September 2021 survey, it was noted that 36% of practices had adopted new telehealth software - a change that happened during the pandemic. The data shown in the graph below illustrates the tremendous progress in adopting and sustaining telehealth from the start of the pandemic in March 2020 until September 2021.

Are you a physician, nurse practitioner, or PA working in primary care?
Help PCC and the Larry A. Green Center track how your practice is responding to the COVID-19 outbreak by completing the Green Center's occasional survey.
The regular surveys are no longer being conducted.
COVID-19 Updates
Maggio 9, 2022 | Primary Care Collaborative
Aprile 19, 2022 | Primary Care Collaborative
Aprile 19, 2022 | Primary Care Collaborative
Marzo 7, 2022 | STAT
Febbraio 27, 2022
- 1 di 39
- seguente ›

Recent News
Agosto 16, 2024
Agosto 12, 2024
Luglio 16, 2024
Giugno 24, 2024
May webinar highlights: “The Commercial Market: Alternative Payment Models for Primary Care” Nate Murray explains w… https://t.co/KX9Wi2w6oY —
2 anni 8 mesi fa
@CMSinnovates’ primary care strategy is rooted in a 2021 @theNASEM’s report which called #primarycare “foundational… https://t.co/glbPxvCysg —
2 anni 8 mesi fa
@CMSinnovates has a new #primarycare strategy, envisioning “ACO-based primary care model tests that may focus on pr… https://t.co/aJGF1z411l —
2 anni 8 mesi fa
- Page 1
- ››
Menu secondario
Copyright © 2024 Primary Care Collaborative

