You are looking at an archived version of our site. Please visit thepcc.org for a fresh, new experience!
You are here: Array » PCMH and Primary Care ...
PCMH and Primary Care Spend: A Different Kind of Investment

PCMH and PC Spend: A Different Kind of Investment
Introduction
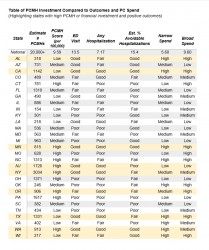
Using MEPS data to analyze the relationship between primary care spend and health outcomes in 29 states, there is an inverse relationship showing that in general, greater primary care investment leads to better outcomes. The outcomes used for this analysis were: percent with at least one Emergency Department (ED) visit, percent with at least one hospitalization, and percent of avoidable hospitalizations. In this trendline, there were several key outliers, namely New Jersey, Colorado, Kentucky, Michigan, New York, and Massachusetts, which showed positive health outcomes in spite of average or below-average primary care spending. What is different about these states that they can achieve such good outcomes without increased primary care investment? The answer may be found in a different kind of primary care investment: infrastructure. Each of these states have highly-developed Patient-Centered Medical Home (PCMH) Programs to serve their patient populations. PCMHs can help to reduce costs and improve population health by proactively targeting and managing patients with common conditions in their practices and by offering a more comprehensive set of services that may not be captured in the PC spend measure.
For the purposes of this analysis, we developed a way of calculating a PCMH “score” for each state by dividing the estimated number of PCMHs in the state by the population and multiplying by 100,000. So, the PCMH score is essentially the number of PCMHs per 100,000 persons in the state. Due to the limits of our data, we were not able to adjust for population attributes such as age and acuity, nor for the number of clinicians in a PCMH. However, we think this score is still useful for purposes of a preliminary analysis and helps to demonstrate the need for more data on PCMH prevalence and characteristics at the state level.
Methods
The estimate for the number of PCMH practice sites by state was informed by reviewing the following publicly available directories: CPC+, MPAPC, Joint Commission, NCQA, PCPCC, AAAHC, and URAC. In addition, each of the 29 states’ health department websites were searched to determine if they had their own state-based accreditation or recognition programs. The estimates of PCMH practice sites by state reflected in the table are a sum of all of these data sources.
It is important to note that this preliminary analysis does not account for the fact that some PCMHs may have multiple accreditations or recognitions while some may have other, lesser-known or no such designation. In short, there may be duplicate or missing practices from this count. Additionally, this initial analysis does not account for the varying number of physicians practicing at each PCMH site, while some are individual providers, some may have many physicians and a much larger practice. This may cause a significant skew for regions where there are many large PCMH practices. That said, this table provides some basic understanding of the overall PCMH presence in 29 states.
The numbers of PCMH sites from each state were then divided by the respective states’ populations, as estimated by the U.S. Census Bureau for July 2018 and then multiplied by 100,000 in order to calculate the number of PCMH sites per 100,000 individuals in the state. The median was then calculated to group the scores into categories of “low,” “medium,” and “high” with the 10 lowest scores in the “low” category, the 9 next scores in the “medium” category, and the 10 highest scores in the “high” category. Next, this method was used to group the narrow and broad levels of primary care spend by state into the same three categories. This method was then similarly used to group the statistics on the number of emergency department (ED) uses, number of individuals with any hospitalization, and the percent of avoidable hospitalizations into categories of “poor,” “moderate,” and “good” outcomes, with lower numbers indicating being better performance.
Discussion
Some of the more highly positive outcomes come from the states of New York, Minnesota, and California, and each has a very different structure for how they address population health and healthcare spending. The example of California is the most straightforward as it represents the type of investment we typically think about: financial. While California has a high number of PCMH practices, they still serve a relatively small proportion of this very populous state, so their PCMH infrastructure is still underdeveloped with a score of only 3.05 per 100,000 (well below the average of 9.59 per 100,000 for the 29 states examined). However, California has very positive health outcomes in this analysis perhaps due to their high level of financial investment in primary care, investing more than the national average by both the narrow and broad definitions of primary care, at 6.11% and 10.22% respectively. Texas also follows this pattern of achieving positive outcomes through higher financial investment with lower PCMH development. Minnesota is an outlier state in that it has made significant investments in both PCMH and in both broad and narrow definitions of primary care investment, More specifically, MN has the highest level of financial investment of any state in the nation at 7.56% for the narrow and 13.08% for the broad definition of primary care. They also have a well-developed PCMH Program, with a score of 14.58 per 100,000. It is possible that with their level of financial investment, using those dollars to further develop their PCMH Program could improve outcomes even more. New York takes the opposite approach from California, and it is a great example of how effective PCMH can be in reducing costs while improving outcomes. While they have below national levels of primary care spending at 5.04% for the narrow and 8.91% for the broad definition of primary care, they have very high levels of PCMH development, with a score of 15.82 per 100,000, over double the national standard. New Jersey also follows this approach, with even lower levels of financial investment while still achieving positive outcomes due to their PCMH investment, which scores 19.39 per 100,000.
| Fichier attaché | Taille |
|---|---|
| 121.16 KB |
Full Resource/Source: Table
Secondary menu
Copyright © 2024 Primary Care Collaborative


